Why Reporting?
One of the most important aspects of delivering value to your clients is being able to show them that the services you provide are having a positive impact for their business. Clients want to know that the money they are spending on your services is worth it and turning them a profit, and at Local View we are excited to provide that information. Marketing data and analytics can be difficult to interpret, so it is essential to report this data to the customer in a way that is easy to understand and allows them to find what they want to know. What information is important to include in a report? How do we make a report easy to understand? How do we organize the report to make it easily digestible? Local View has the answers.
What We Do: The Executive Report
Local View offers our clients a service called Advanced Reporting. With Advanced Reporting our clients can see automated reports in their Business App Dashboard that will show key information about their marketing efforts. An Executive Report is sent out automatically on a weekly basis. This report is the one stop shop for all the information you could want about your marketing services, showing performance indicators and relevant data about your Marketing Funnel, Online Listing Services, Reputation Management, Social Media Marketing, Pay-Per-Click Advertising, and Website SEO. The report is set up so that the client can scroll through and see relevant and easy to understand data and visuals that are neatly organized.
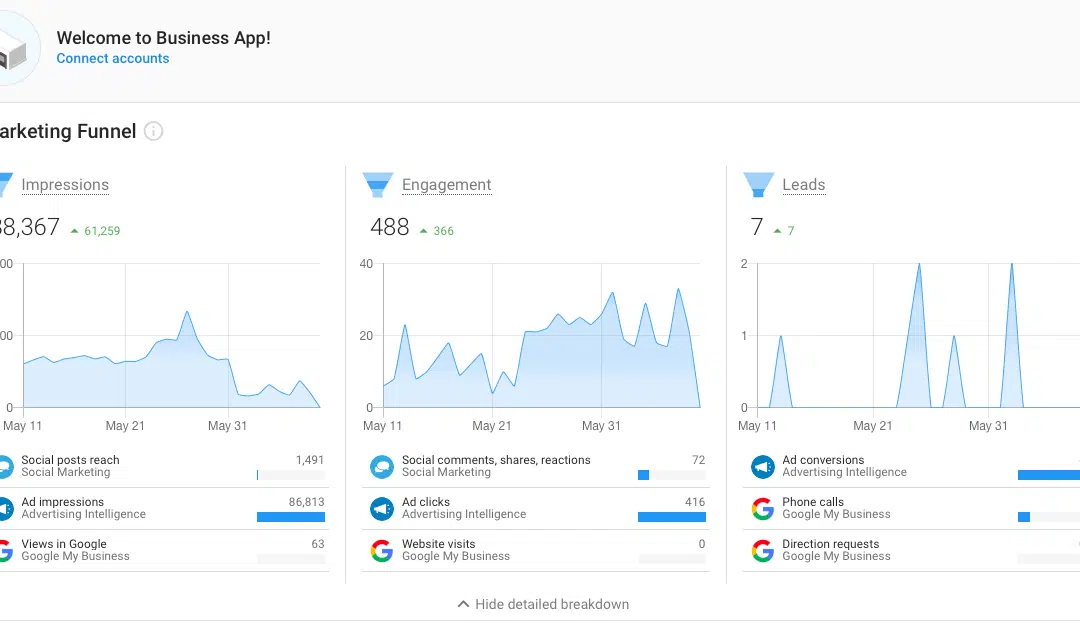
In the Marketing Funnel section of the report it shows overall Impressions, Engagements, and Leads across the various marketing services. Following that overview are the categorized sections where the report shows valuable information for each category and gives the client a Grade that is representative of how their efforts compare to the industry average.
The first category is the Listings section where clients can see all of the online listing sites that they are present on, how customers find the business, actions taken on the listings, and more.
The second category is the Reputation section in which clients can see their average rating out of 5-Stars across all online reviews. Clients can also see new reviews and respond to or manage these reviews right from the dashboard.
The third category is the Social section that shows how the business is engaging with their community and customers online. From here you can see data about the quantity of social posts, engagement and reach for the posts, and which social media posts are performing better than the rest.
The fourth category is the Advertising section. In this section of the report the client can see their performance metrics for each of their online advertising efforts, including Google Ads, Local Service Ads, Facebook Ads, and Email Campaigns. In this part of the report there are also links to the Advertising Intelligence dashboard where much more in-depth and specific information on these advertising efforts can be found. More on that in the next section.
The fifth and final category in the Executive Report is the SEO section. SEO is an important indicator of whether or not you are showing up first when people search for services or products that you provide. In this section the client can see data from Google Search Console, monitor backlinks, find top performing keywords, and see overall data for Organic, Referral, and Direct traffic.
The Executive Report has information which shows clients that what we do is yielding results and that our services get them real ROI they can see every week.
Advertising Intelligence
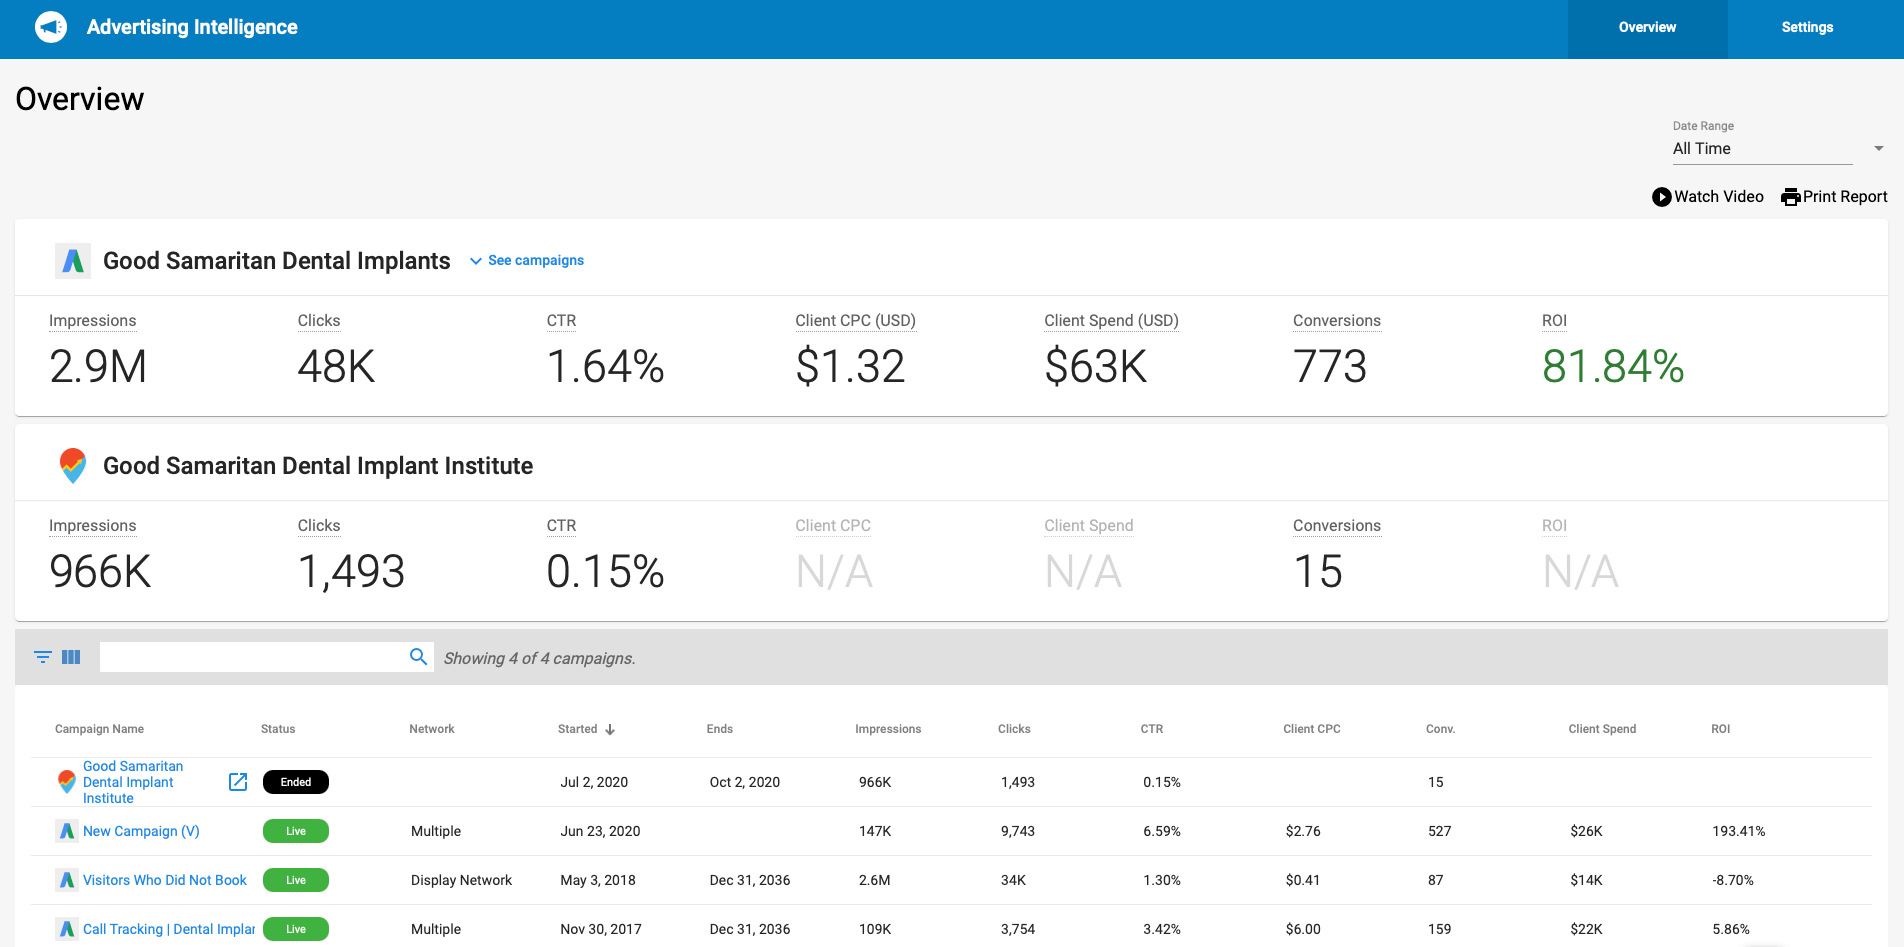
Pay-Per-Click Advertising is a complex endeavor, and ROI can be much more difficult to interpret with so many intricate factors to consider. That’s why we provide clients with even more in-depth reporting accessible at any time through Advertising Intelligence. With Advanced Reporting, our clients can look at their Advertising Intelligence dashboard to see in depth stats for their Google Ads, Facebook Ads, & Local Service Ads. From this dashboard the client can see their Impressions, Clicks, Click-Thru-Rate, Average Cost-Per-Click, Total Spend, & Conversions for any time period. If provided with the Average Sale lifetime value of a customer and Close Rate percentage of leads that turn into business, the dashboard will also show an actual Return On Investment percentage that represents how much profit has been gained from online advertising efforts. These valuable metrics are not only available for each advertising account overall, but also for specific campaigns, ads, keywords, and Google Analytics Goals that are active and linked to the advertising accounts. Finding out if your online advertising is working can be difficult and overwhelming, but with Advanced Reporting it doesn’t have to be.
Reporting Recap
At Local View we want to make sure that each and every one of our clients knows that they have made the right choice by trusting us and our services. What better way than to show them the key details of the results and ROI that our services bring to them. We prepare an Executive Report that is organized into sections to make it easy to digest, and lay out the included information and data in a way that is visually pleasing and not overwhelming to the viewer. We also make sure that the client knows exactly what is going on behind the scenes of their Pay-Per-Click Advertising with Advertising Intelligence, so they have all the reporting they could ever want whenever they want it. Our results speak for themselves, and we prove ROI to our clients 24/7 with Advanced Reporting.